Safeguard Send for Microsoft 365 is not only a powerful tool for preventing outgoing email mistakes but also an invaluable resource for managers. The Send Metrics feature provides detailed insights into your organization’s email activity, allowing managers to identify the most prolific emailers and understand how often users revise their emails after being prompted. This feature is now available as a report in your dashboard. In this article, we will explore the Send Metrics report, guide you on how to access your company’s send metrics, and demonstrate how to leverage this data to enhance email security and efficiency.
What is Send Metrics?
The ‘Send Metrics’ feature provides administrators with detailed insights into email usage and revision patterns within their organization. This helps to show managers and other high-level executives the value that Safeguard Send for Microsoft 365 is providing.
How to Access Send Metrics:
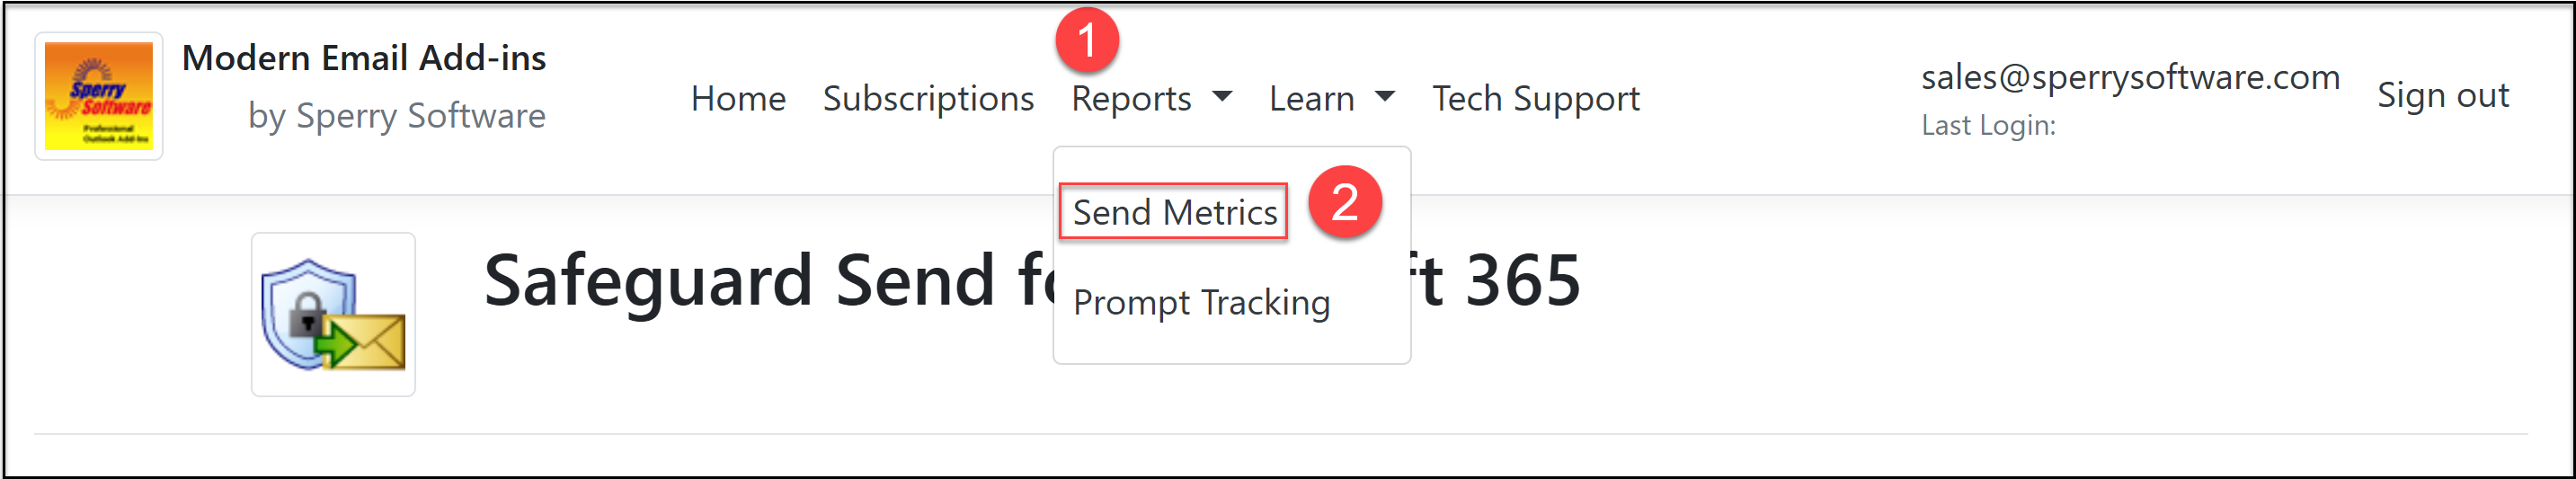
1. Log into your Safeguard Send dashboard
2. Click on “Reports”
3. Select “Send Metrics”
What You’ll See:
Key metrics of the Send Metrics feature include the total emails sent by both the entire company and by individual users, the total number of times users went back and revised something (that is, they clicked on “No” or “Cancel” when prompted by the add-in) and of course, the revision percentage (again, for your entire organization and for each user).
The Send Metrics report provides the total statistics for all users in your company (the bold header area at the top), along with individual user statistics and comparison with global averages across all users of the add-in:
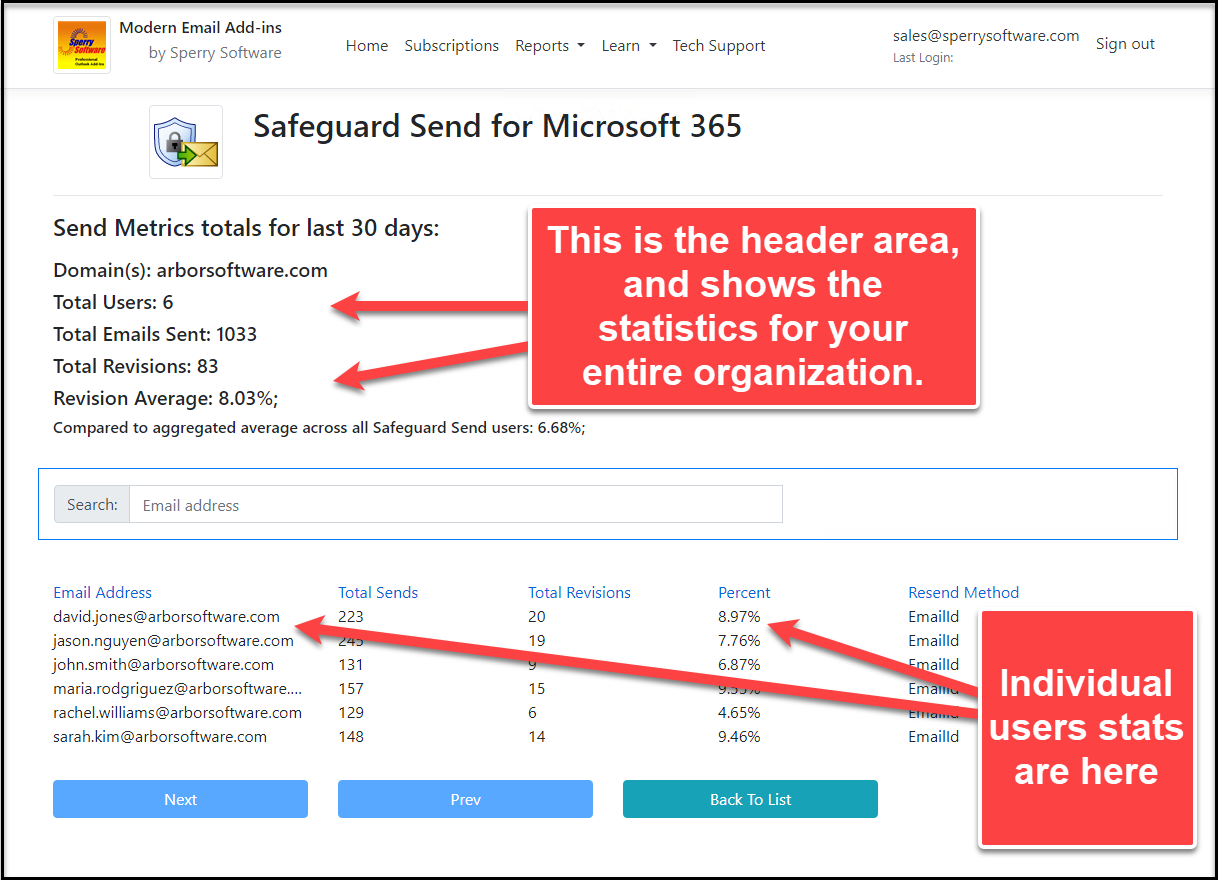
In the above sample image, a sample Send Metrics page is displayed. We use fake data from Arbor Software, our fictitious corporation.
The first item listed is the header stats for the last 30 days for all your domains aggregated together. The default is to go back 30 days.
The Total Users is the count of who used the add-in in the last 30 days. In this case, there are a total of 6 users.
The Total Emails Sent is the count of the number of times that an email was sent by all users in your organization.
The Total Revisions is the number of times that all users, presented with the warning prompt because of a potential rule violation, clicked on the “No” (or “Cancel”) button.
The Revision Average is the ratio of Total Revisions/Total Emails Sent. The aggregated average of this value across all users of the add-in is also included.
Below the header area is a search bar, so that you can easily find a specific user.
Of course, you can always click on any of the column headers to sort by that column. Clicking again sorts in the reverse order.
The Resend Method is used to show you how the add-in calculates the Send Metrics statistics for a particular user. In general, there are two ways statistics are calculated:
- Timestamp Method – This method relies on the amount of time it took between two invocations of the warning prompt. We assume that if a user took less than 30 seconds between two displays of the warning prompt that the user in that case is editing the same email, meaning that there was at least one revision occurred.
- Email Id Method – This method is more accurate than the Timestamp method. It works by assigning a unique Id to the user’s email when they send it. If the user clicks “No” (or “Cancel”) then revises the email in some way (adding or removing recipients or attachments for example), then attempts to send that email again, the add-in takes note of the already existing Email Id and marks that down as a revision.
Note that the more accurate Email Id is used by default for all users who are using v4.2 of the add-in (or higher). Also, that the default of considering any two email sends within 30 seconds as being the same email comes from our own analysis of how long it takes users to revise an email, when using the Email Id method. In other words, knowing how long it takes the average user to go back and revise an email when using the Email Id method makes it a lot more accurate even when we don’t have an exact value.
Finally, note that when it comes to the Total Emails Sent value, that it really isn’t the total emails sent by the user. This is because if there are any networking issues or any problem reaching the sperrysoftware365.com servers, then the client side portion of the add-in is smart enough to use the last locally cached version of the rules. In these cases, there will be no indication that the user attempted to send an email.
Understanding the Data
If you think about it carefully, a high revision percentage by a particular user may indicate careful attention to prompts but is otherwise careless in their initial composing of the email.
By contrast, a low percentage suggests careful initial composition (or lack of attention to prompts!).
Nonetheless, this data can be used to identify training opportunities or adjust rules for specific users.
See Also:
How to Create and Test New Rules or Make Changes to Rules Before Rolling Them Out to Everyone
How to Add Rules For a Different Company Domain
How to Force Users to Confirm Each Recipient and/or Attachment Before Sending Email